Animator Graph Viewer
April 2023
Context
In software development, code analysing and understanding the relationships between different classes is crucial. To aid me in this process, I wrote a simple program that created a mapping between classes and data. After a bit of thinkering, I wanted something I could interact with to better map and organise my thoughts. I developed using d3.js, svelte, and vite, a program that provides an user interface for visualizing these relationships.
Realization
Getting classes data
To generate the data used in the visualization, I wrote a Node.js script that uses regex to parse TypeScript files containing class definitions. The script recursively searches a directory for .ts files, reads their contents, and extracts the class names and their relationships. I used the fs and path modules to traverse the directory structure and read the files. For parsing the files, I used regular expressions to match the class declarations, their parent classes, and the types of their properties and methods. The parsed data is then saved as a JSON file that can be loaded by the visualization. This process allowed me to automate the generation of the data and ensure that it’s always up-to-date with the latest codebase.
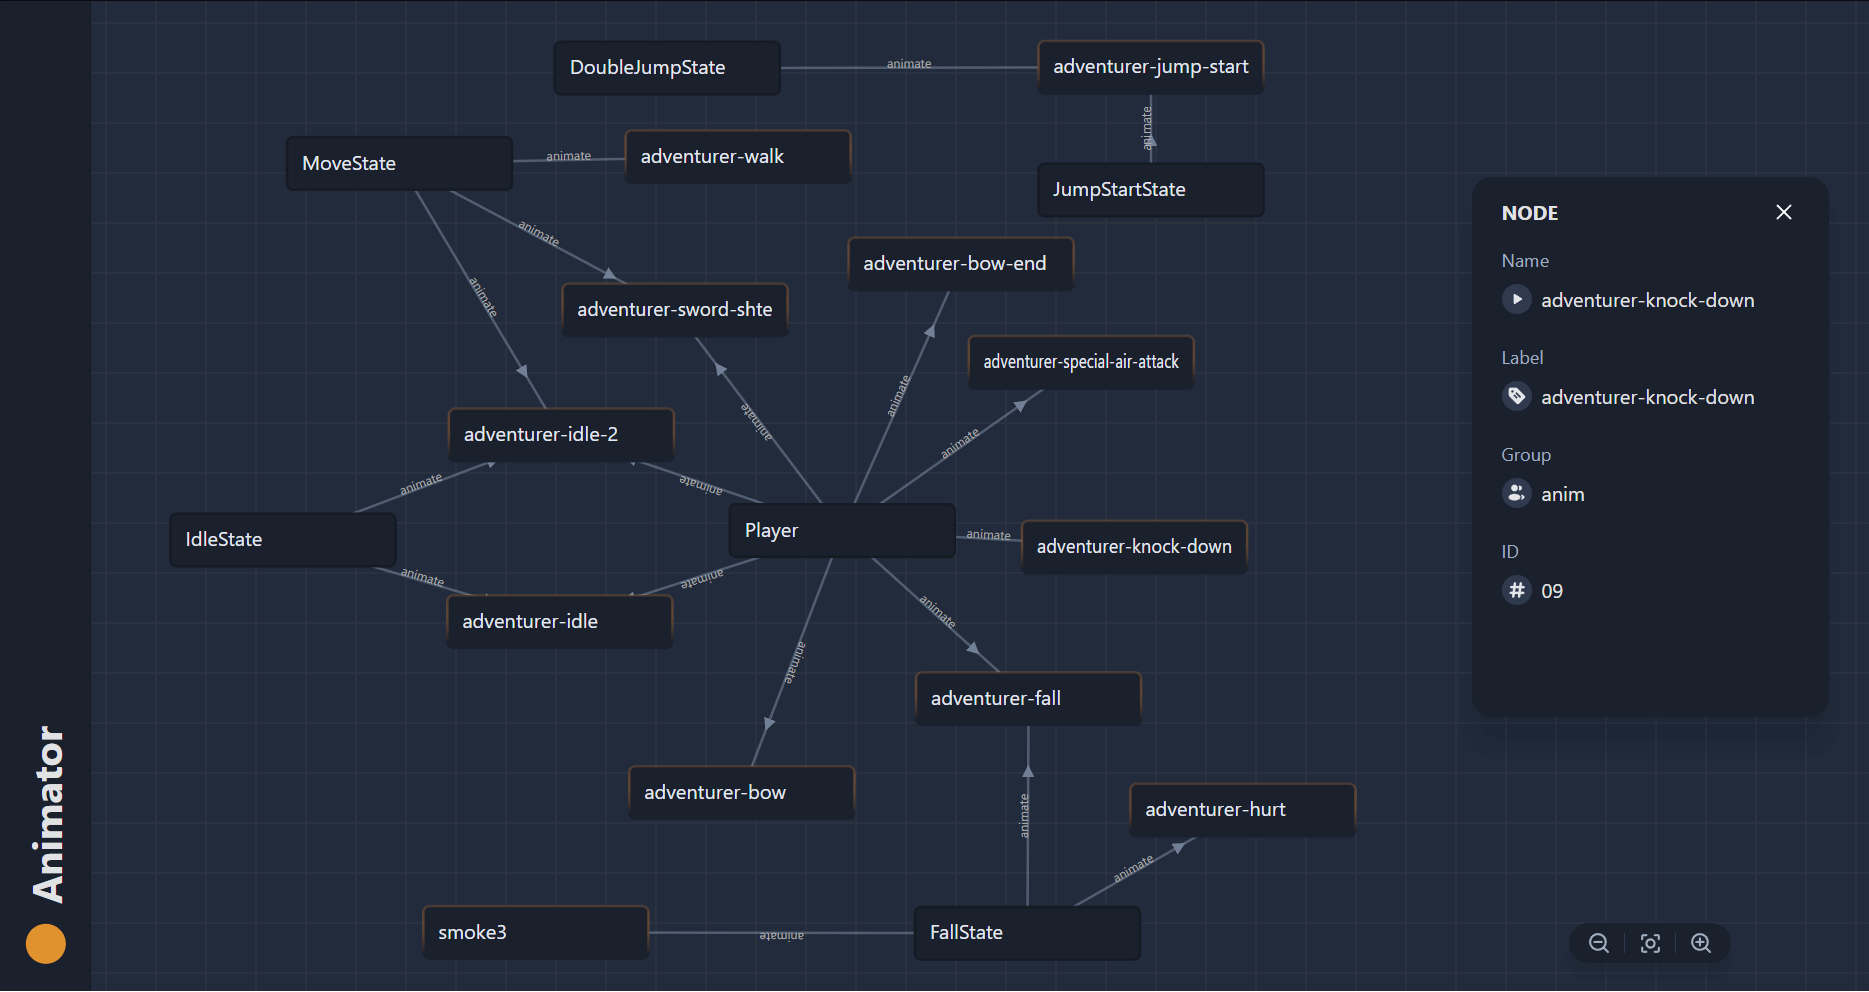
Visualizing data with D3.js and Svelte
I started by setting up the project with Vite and Svelte, then created a new component to hold the visualization. Using D3.js, I wrote code to generate the necessary HTML and SVG elements and bind them to the data generated by my Node.js script. I used D3.js to handle the zoom and pan functionality, and added event listeners to update the visualization in response to user interactions.
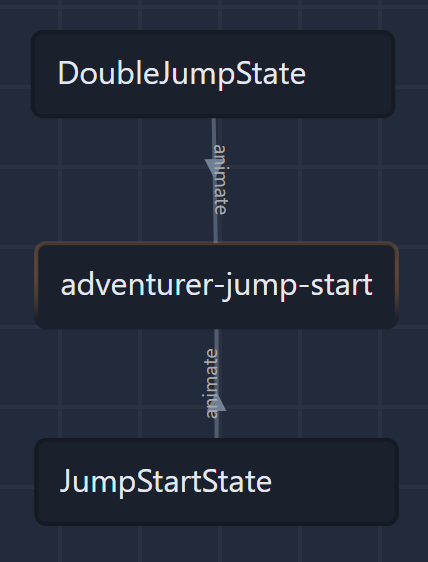
Drag and drop
D3.js provided an easy way for me to implement drag and drop functionality in my visualizations. When I want to allow users to drag and drop elements in my visualization, I simply need to call the d3.drag() function and specify event handlers for the “start”, “drag”, and “end” events. During a drag operation, D3.js automatically sets the x and y attributes of the dragged element based on the mouse position. This allows me to easily implement interactive features in my visualizations without having to manually track the position of the mouse.
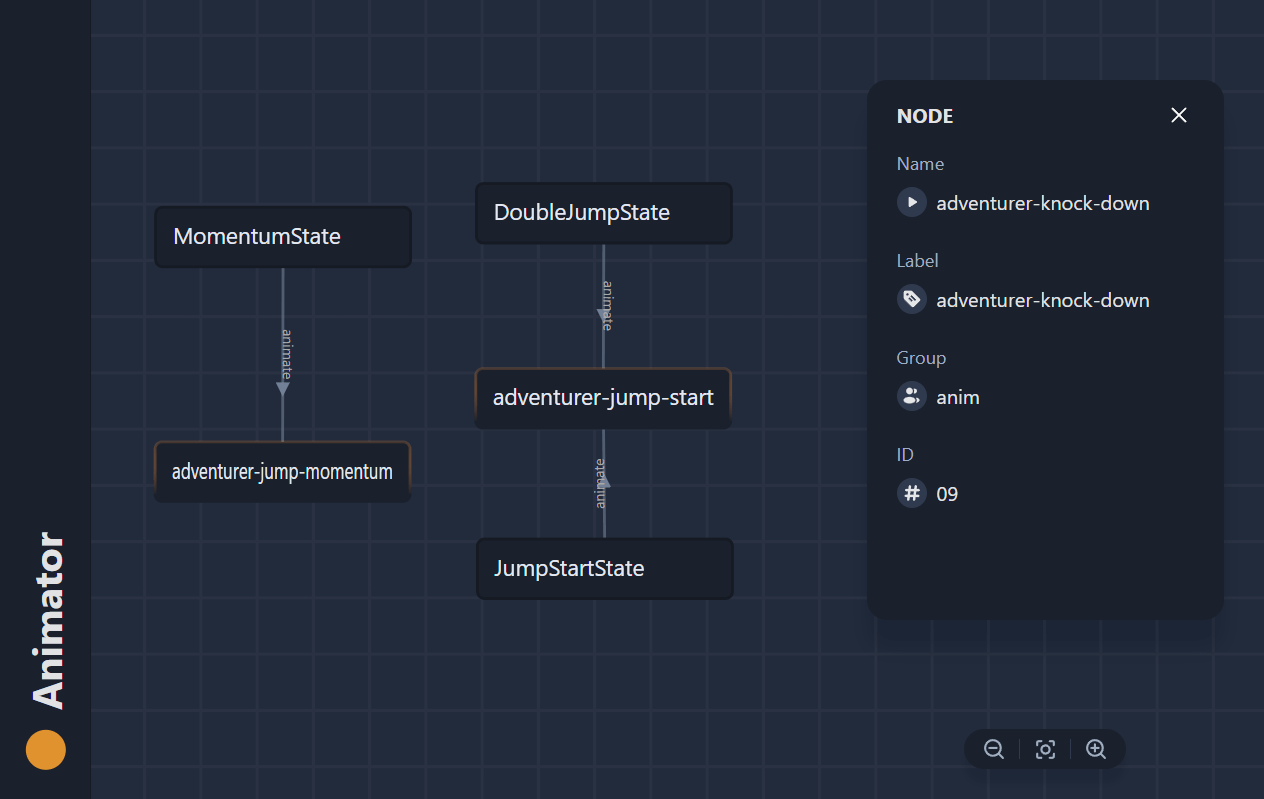
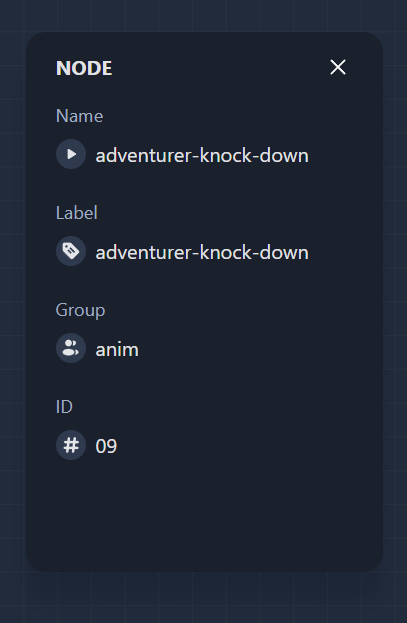
Using stores for a reactive UI
I used Svelte’s writable store to create a store that contains an object representing various details about a node. Whenever a node is clicked, its details are set in the store, which triggers any component that is subscribed to this store to be updated with the new details. This way, the interface remains reactive to changes made in the store, and any component that depends on this data is updated automatically. This is a common practice in Svelte for handling shared data between components and is useful for keeping the interface in sync with the underlying data.
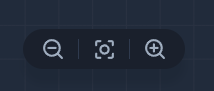
Floating action bar
To improve the user experience, I added tooltips to display additional information about each class and animation on hover. I also wanted to provide a simple navigation bar with zoom control.
D3 provided me a convenient way to implement zoom functionality in SVG elements using the zoom behavior. This behavior can be applied to a selection of SVG elements and attached to the zoom event, allowing the user to pan and zoom the view with their mouse or touch input.
To use this functionality in a Svelte application, it is possible to pass the reference of the SVG element and the zoom behavior as parameters to a ZoomPanel component. In this way, any user interaction with the component can trigger the zoom behavior, and the SVG element will be updated accordingly. I used the scaleBy method of the zoom behavior to zoom in on the SVG element that I passed references into my ZoomPanel component on every clicked.
Lesson learned
Overall, I’m happy with how the project turned out. The combination of Vite, D3.js, and Svelte made it easy to create a responsive and interactive interface for visualizing complex relationships between classes and animations. D3 is definitely a powerful tool that allowed me to create engaging and dynamic visualizations that can provide valuable insights into complex data sets. A big plus is how it’s leveraging the power of SVG graphics, making easy to create sophisticated and interactive visualizations that can help users explore and understand complex information.
I am excited to continue exploring the capabilities of d3 and svelte in future projects. Next time I’ll feel confident using D3 for future data visualization projects requiring complex interface. I do look forward exploring more of what D3 has to offer in the future !
Also Read
-
-
TailWind CSS practice
Discord's Landing page clone
Trying to make an almost-identical clone of the Discord landing page with TailwindCSS and SvelteJS
-
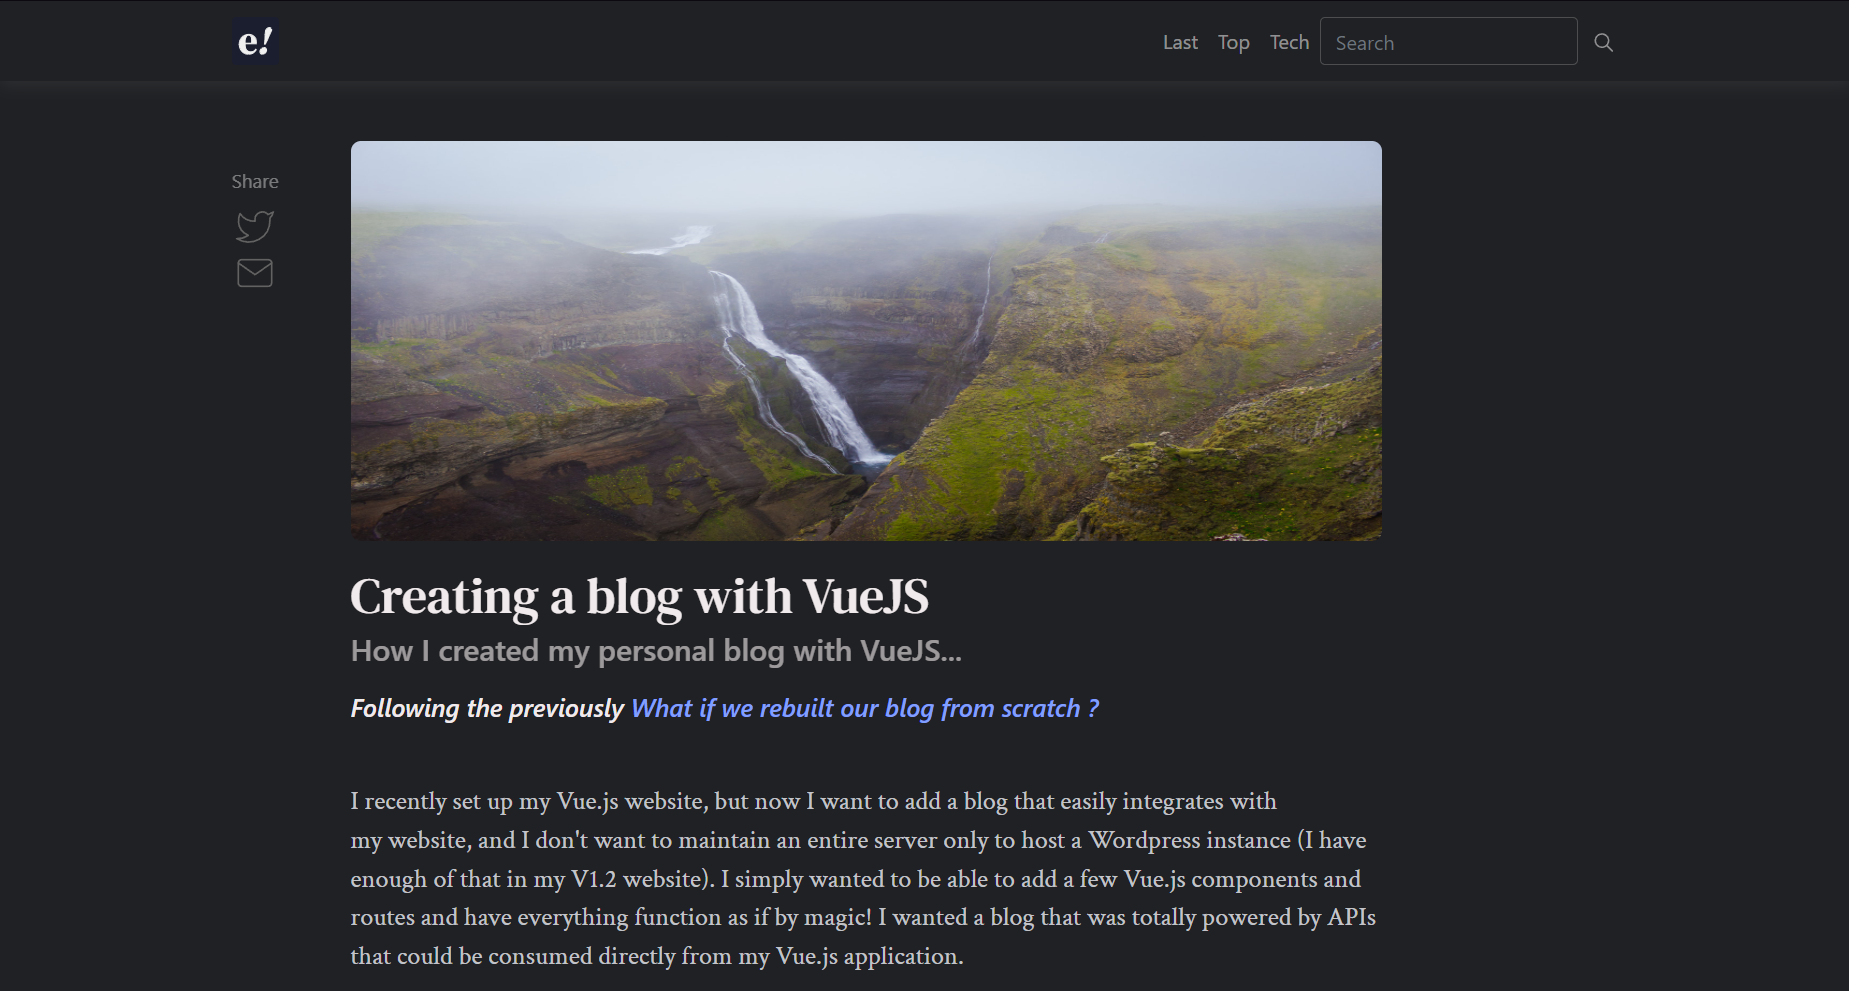
Headless personal Blog
Misete
Building my (old) personal blog with VueJS 2 as an headless blog that fetch data from Symfony API